If you've been searching for the best source of information and stimulating discussion related to Spring/Summer/Fall backpacking, hiking and camping in the Sierra Nevada...look no further!
I'm in the process of adding an informational feature to my website that provides an example of how I sometimes analyze and graphically document my backpacking trips. Although there is little practical enhancement to one's actual backpacking experience in what follows, especially for the solo person, it does provide an improvement when trying to communicate the nature of tentative backpacking trips to other prospective participants or to post trip audiences. For instance, on some of our trips, I create multimedia CDROMs in HTML format that includes photographs, camera videos, topo maps with drawn routes, chronicle text descriptions by each participant day by day, and other graphic information of a trip. Later the CDROM is distributed to participants as well as others that may have an interest. Much like a photograph years later allows one to visually recall such backcountry experiences, a well-made multimedia CDROM does so even better.
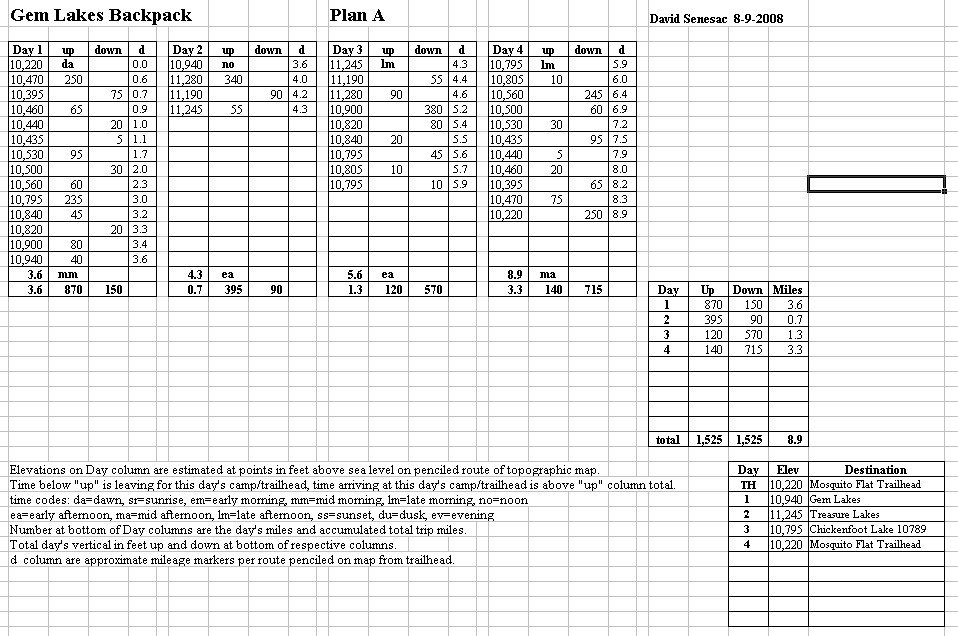
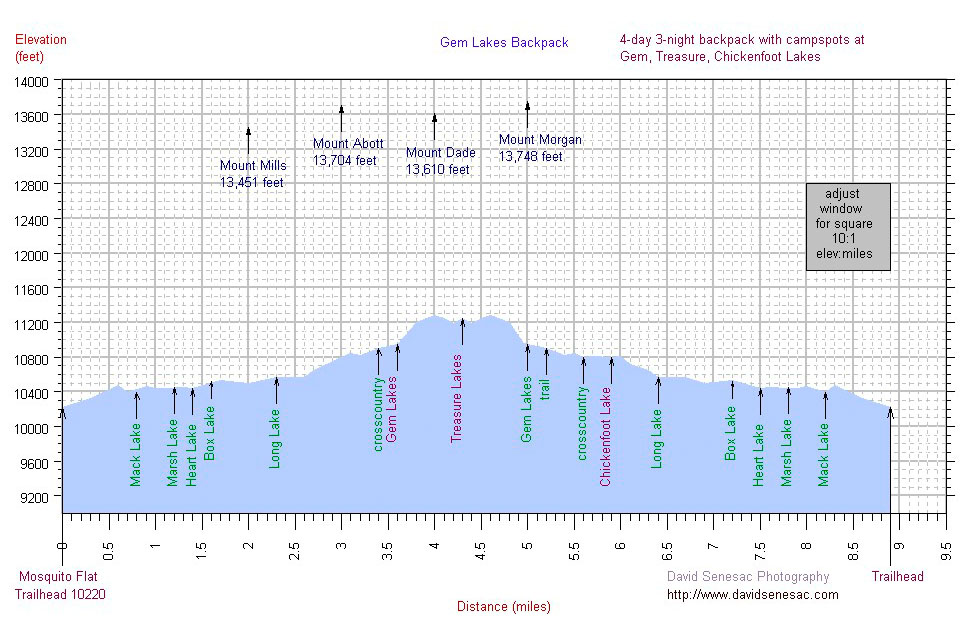
The following concerns two subsets of that process. Some of the most useful information planning for a trip is understanding the mileage to itinerary destinations and the up and down vertical elevations along the route. For the first process I use a spreadsheet to automate calculation of information. The key information provided on the sheet are the daily totals of mileage and up and down verticals to and from specific itinerary locations, and trip totals for such. Thus a snapshot image of an example spreadsheet for a future Little Lakes Valley trip follows. The second image below of information creates a plot application graphic of the route with elevation on an Y-axis and mileage on a X-axis.
I'm interested in what some of you savvy mountain people think of these creations before I go more public with how to create them. Of course the plot graphic for longer trips with much more mileage and vertical is more interesting to look at though this short trip works well as a one page example herein.